Fall is a Good Time for 2026 Planning Is it time to build your next…
7 Ideas for Every Day Industrial Marketing
This post originally appeared on the Academy blog. To read more content like this, subscribe to Academy.
As a marketer, tracking and analyzing data is an important part of the gig. But there are so many different metrics you can track. Where do you begin? (And better, how do you ultimately improve your metrics once you understand them?)
In this post, we’re going to cover some of the most important metrics you should track on a weekly basis to help keep you more agile. Remember, if you keep a close eye on these metrics, it’ll help you pivot and adjust your marketing campaigns more quickly, helping to get closer to those looming monthly goals.
After that, we’ll go over how to improve them, as well as how to prepare for the following week.
7 Metrics Every Marketer Should Check Weekly
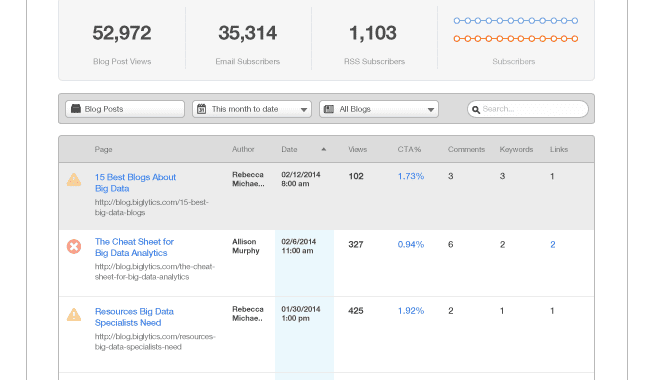
1) Blog Post Views
Tracking the number of views you get per blog post is great way to get quick feedback on your blog articles. You’re more likely to get a higher view count if you picked a topic your audience liked and wanted to share.
If you’re a HubSpot customer, you can get this information in Page Performance. To see post-level view counts as well as total view count, sort the columns within the tool by number of views, and pick a time frame like one month. Now you can see how your recent posts have performed against each other.
Want an extra tip? You can also compare your recent posts’ view counts to your overall average by exporting that data and running an average of all your posts in Excel.

How to Improve Your Blog Views
Measure blog post views to figure out which blog content is performing the best. Knowing what content naturally got the most views can help you decide what topics and types of posts to write next. You should use this information to plan out your next few weeks of content so you’re writing the posts that will drive the most views, and help you hit your monthly goals. And by looking at this information week over week, you can make adjustments to your content schedule to improve your results.
2) CTA Clickthrough Rates
After someone reads your content, you want that person to take the next step and click on your call-to-action (CTA). The metric you should most closely measure for CTAs, then, is your click-through rate, or the percentage of folks who clicked on the CTA.
If you’re using HubSpot’s CTA tool, you can track the performance of different CTAs and see which ones are performing best. You could even take it a step further and show a Smart CTA based on a reader’s lifecycle stage or membership to a list.
How to Improve Your CTA Clickthrough Rates
First, take a look at what CTAs are performing the best today. Then, decide if there are higher conversion rates on certain types of CTAs, as well as what might cause that better performance. Is it the design of the CTA? The content positioning? Is the content that the CTA is promoting more appealing than your other content? For example, if you have high conversion rates on CTAs that lead to a worksheet and lower conversion rates on CTAs that lead to a whitepaper, that may mean your audience prefers worksheets over whitepapers. Embrace agile experimentation to figure out why certain CTAs perform better than others.
3) Social Media Reach
Tracking the performance of your social media is important to understanding its ROI. A social media goal that many companies have is increasing the size of their social network, or their total number of fans and followers. Why is a large social reach valuable? So when you publish your content, you can reach a larger number of people who might read and share it.
So … do you see a bump in your social analytics? What did you do differently last week that might have helped you grow your network?

How to Improve Your Social Reach
If you see an increase in your progress from a particular week, think about what specifically you did to attract more followers or fans around that time. Was there a marketing campaign going on? Did you newsjack something insanely popular? What type of content did you publish on these channels?
It’s important to check these stats on a weekly basis so the strategy and the content you posted is fresh in your mind. After you decipher what caused your bump, use it to inform next week’s media plan.
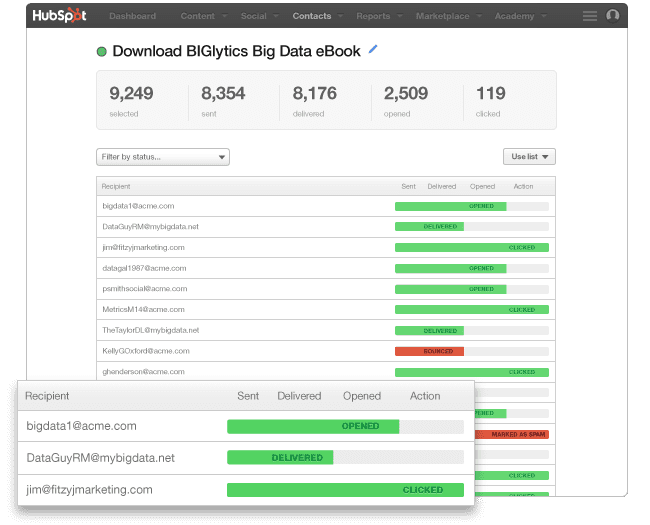
4) Email Clickthrough Rates
When you’re looking at your email marketing metrics, the most important metric is not how many people opened your email. I would argue it’s how many people clicked through to reach the content that the email was promoting. That could be the number of people who clicked a link in your email, or clicked on the CTA in that email. This metric is known as your email clickthrough rate, and you should be able to get it right in your email tool.
How to Improve Your Email Clickthrough Rates
By measuring your email marketing, you’ll get a sense of what your audience wants to read by email. (Sometimes your content may perform well on email and not other channels, so it’s worth experimenting.) Take a look at the performance of different emails and look closely at the ones that performed the best. Did you promote a particular piece of content? Did you use a certain tone? How clear were your calls-to-action? Based on what you discover, create similar emails that embody some of the tactics that made your emails successful in the past.
Bonus: You can A/B test your emails to help improve clickthrough rate, too. The CTR of each email variation will help you determine what email elements are most successful.
5) Landing Page Conversion Rates
Arguably the most important metric for marketers to keep their eyes on is lead conversion, or the percentage of visitors who convert into contacts by filling out a form on a landing page. The conversion rates of your landing pages will then determine how many leads you’re able to generate.
If you’re using HubSpot’s reporting tools, it’s easy to measure the success of individual landing pages. Whatever tool you use, though, be sure you measure how many people are visiting your landing pages, the conversion rate of those pages, and whether the leads generated from those landing pages become customers. These metrics will help you determine which content offers and landing pages to use when marketing through other channels.
How to Improve Your Landing Page Conversion Rates
Take a look at your landing page dashboard. Which pages have the highest conversion rates? Which pages have the most views? Look closely at your high-performing landing pages to see what made them successful. Was it the content piece on the page? Is the form optimized for your audience? Did you personalize the content on the page? Did you send the landing page to a particular segment? Identify what attributes made one landing page more successful than others, and then replicate it for future conversion wins.
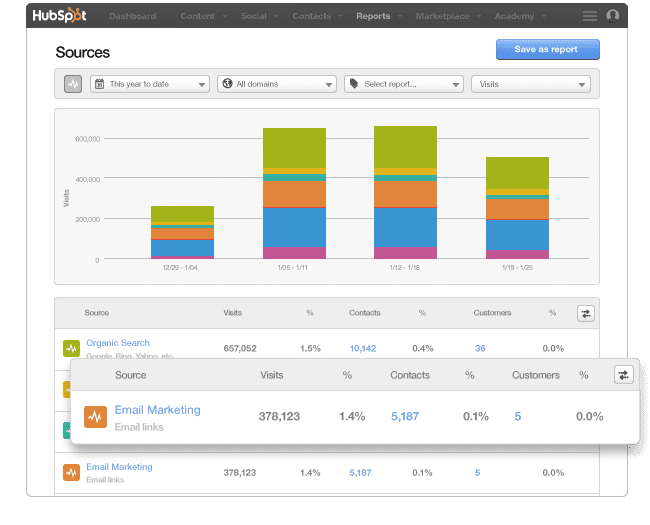
6) Traffic Sources
You need to figure out who’s coming to your website, and how they found you. If you do anything, make a habit to check this report once week — at least!
By using a sources report, you’re able to understand what marketing campaigns have the highest ROI. This report should display data from your main marketing channels to give you a better understanding of where your traffic is coming from. For example, you could get traffic from any of the following sources:
- Organic Search: Visits from organic search results in search engines such as Google and Yahoo
- Referrals: Visits from inbound links on other websites
- Social Media: Visits from social media sites including Facebook, Twitter, LinkedIn, etc.
- Email Marketing: Visits from emails you’ve sent
- Paid Search: Visits from paid search results from search engines or other PPC providers
- Direct Traffic: Visits from people who type your website address directly into their browser
- Other Campaigns: Visits from people who came from a unique tracking URL
- Offline Sources: Leads and sources for which there is no source set
You should also look at the number of visits, leads, and customers as a result of those channels, as well as each of their conversion rates.


How to Grow Your Traffic
You should always focus on growing your strongest marketing channels and making them work even better for you. In the example above, organic traffic is the biggest driver of traffic to the site, but social media has the highest conversion rate. By digging into the specifics and adjusting the date range, you can really understand how the different channels perform to help you hit different metrics.
So figure out what channel is performing the best, and think about what you did that past week to contribute to its success. (Seeing a theme in this article?) If you only used certain channels in a week, highlight just those channels. For your next week, plan on replicating your success by either focusing on those channels that performed well, or creating similar content that led to the traffic bump.
7) Monthly Goal Progress
Even though you should be looking at certain metrics on a weekly basis, you should always keep your eye on the prize: your end of month goals. The adjustments you make throughout the month by looking at your data on a weekly basis can really contribute to whether or not you reach your monthly goals.
A great place for HubSpot customers to track monthly progress is on your Dashboard. If you aren’t a customer, you can set one up using Excel. Using the Dashboard, you’re able to set goals month over month and watch your progress each week. You’re even able to see how your current monthly progress versus the previous month.

How to Get Ahead of Your Monthly Goal
There isn’t one single way to improve these metrics besides tracking and iterating on some of the metrics we covered earlier in this post. Drill into the data to discover how you’re performing against your goals and what you can do to improve going forward. As you can imagine, keeping yourself up-to-date on a weekly basis will help you stay on track.
At the end of the day, your metrics help you be a more informed and nimble marketer. Make a commitment to always be tuned into your metrics, and your marketing will thank you for it.
What other metrics do you check on a weekly basis? Which metric could you never live without? Let us know in the comments!
If you liked this post you would like, “Review: “Designing B2B Brands” for industrial marketing communications.“
Related Posts